Introduction and History
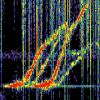
The first VLF “triggered emissions” were recorded in November 1959 by the Stanford International Geophysical Year VLF receiver located in Wellington, New Zealand [Helliwell et al., 1964]. The transmitter was the US Navy VLF transmitter NPG, located in Jim Creek, Washington. The transmission was an 18.6 kHz pulse which consequently triggered weak, rising frequency tones [Gibby, 2008]. A sample spectrogram of a rising frequency tone is shown in Figure 1.
Introduction and History
The first VLF “triggered emissions” were recorded in November 1959 by the Stanford International Geophysical Year VLF receiver located in Wellington, New Zealand [Helliwell et al., 1964]. The transmitter was the US Navy VLF transmitter NPG, located in Jim Creek, Washington. The transmission was an 18.6 kHz pulse which consequently triggered weak, rising frequency tones [Gibby, 2008]. A sample spectrogram of a rising frequency tone is shown in Figure 1.
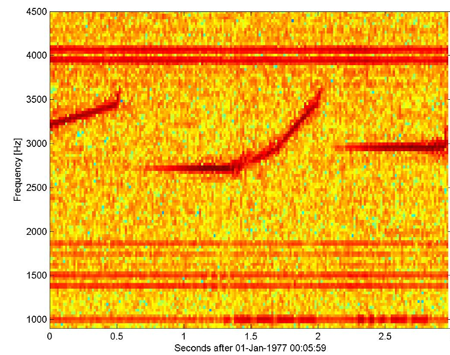
Figure 1: Spectrogram (frequency vs time plot) of a triggered emission, a constant frequency pulse triggers a tone that rises in frequency.
Much of the phenomena exhibited by triggered emissions is thought to be a result of cyclotron resonance between energetic charged particles (usually electrons) and injected VLF waves. This resonance can take place when the frequency of the incoming wave, in the reference frame of the electron, is equal to the frequency at which the electron gyrates around the Earth’s magnetic field. A visual description of this phenomenon is depicted in Figure 2.
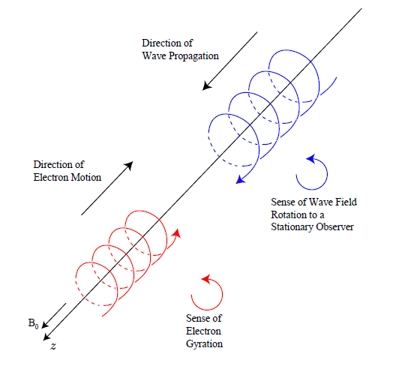
Figure 2: As the electron gyrates along the magnetic field it encounters an incoming circularly polarized wave. Resonance can take place when the Doppler shifted frequency of the wave matches the electron gyrofrequency [Gibby, 2008].
These wave-particle interactions yield a vast range of physical phenomena that is yet to be understood theoretically. Many of the equations that describe the behavior of these interactions are non-linear and require more complicated methods to solve.
Designing and implementing a controlled experiment on triggered emissions requires many factors to be taken into account. The waves need to be injected at the correct region in order to interact with energetic particles. A receiver would also need to be placed at the conjugate point in the opposite hemisphere. Figure 3 demonstrates the overall mechanism for a triggered emission experiment.
Figure 3: Presumed mechanism for a triggered emission experiment
The Siple Experiment
The Siple experiment was a Stanford, NSF funded, VLF- triggered emission experiment that took place from 1973 to 1988. The Station included a 21.2 km dipole antenna located in Antarctica at 75.93 S, 84.25 W.
Why Siple?
The location for Siple Station was picked for numerous reasons:
- The station was located in Antarctica where it was effectively isolated from major EM noise in the VLF spectrum.
- The 2 km thick layer of ice provided elevation above the conducting ground, which improved antenna efficiency.
- At L~4.3, transmissions can reach high magnetic latitudes in the plasmapause, which is likely the location of the interaction region
- The magnetic conjugate point was in an accessible place, near the city of Roberval (also in Lake Mistassini), Quebec.
What was done?
The objective of the Siple transmitter was to produce various formats, which allowed for controlled experiments to answer specific questions regarding triggered emissions. The observed data after transmission included many unexplained phenomena. Some of the more obvious phenomena includes (but definitely not limited to): rising and falling emissions, wave growth, entrainment, and multiple-hop echos. Figure 4 shows an example of a transmission format and a received signal.
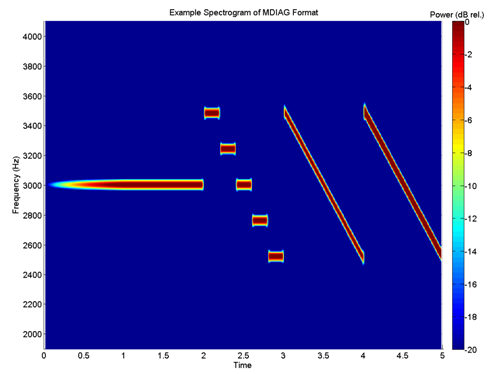
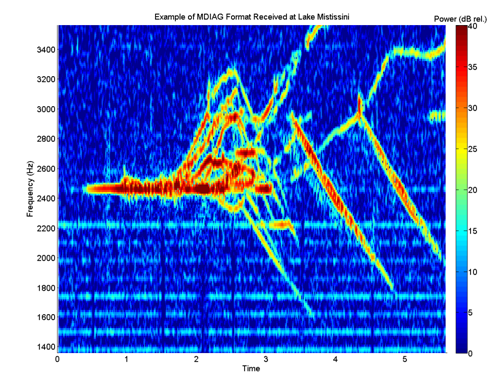
Figure 4: Left) Spectrogram of transmitted format (MDIAG) from Siple Station. Right) Spectrogram of the received signal after triggering
In addition to triggering additional frequencies, the waves injected into the interaction region often show considerable amplifcation. Received amplitude values can often range from 30dB to 50dB which is tens to hundreds of times the amplitude of the transmitted signal. Figure 5 shows a sample spectrogram of rising triggered emissions with the corresponding amplitude plot in a small bandwidth around the transmitted frequency (2.83kHz).
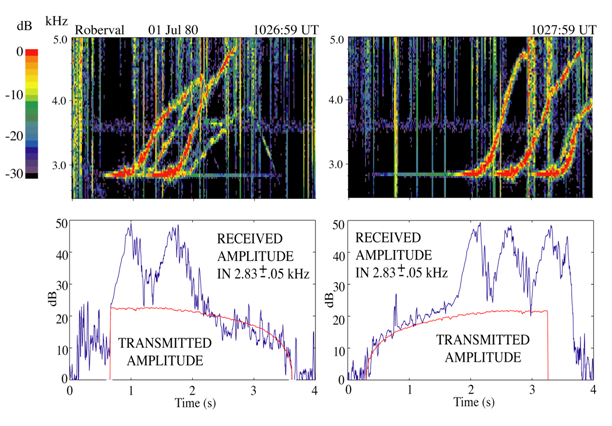
Figure 5: This figure shows some triggered rising frequency tones that were observed at Roberval.
The amplitude plots demonstrate growth of 30dB.
Current Research
The data produced from the Siple station is so rich and extensive that to this day, much of the data is yet to be processed and analyzed. There are various aspects of the data that are currently under scrutiny. One interesting topic is the phenomena known as multiple hop echos. Figure 6 shows transmitted pulses being triggered and then echoing from receiver to transmitter. There is currently little understanding of why and when this sort of hopping is seen, but further analysis of data provided by Siple should provide a clearer understanding of the processes that lead to multi-hop observations.
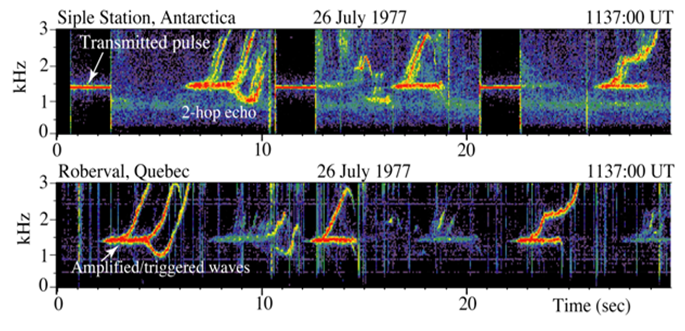
Figure 6: The spectrograms show 30 seconds of transmitted pulses and the received triggered emissions at Roberval. In this segment, 1-hop, 2-hop and even some 3-hop echos can be seen.
Acknowledgements
Current research on Siple data is being sponsored by The Office of Naval Research.
References
Gibby, A, “Saturation Effects in VLF Triggered Emissions,” Ph.D. dissertation, Stanford University, 2008.
Helliwell, R. A. , Siple station experiments on wave-particle interactions in the magnetosphere, Wave Instabilities in Space Plasmas, P. J. Palmadesso and K. Papadopoulos (eds), 191-203, 1979b.
Helliwell, R. A. , VLF wave-injection experiments from Siple Station, Antarctica, Adv. Space Res., 8 (1), 279 – 289, 1988.
Helliwell, R. A. , Controlled stimulation of VLF emissions from Siple Station, Antarctica, Radio Science, 6, (A6), 801-814, 1983.
Bell, T. F. , U. S. Inan, I. Kimura, H. Matsumoto, and K. Hashimoto, EXOS-B/Siple VLF wave-particle interaction experiments: 2. Transmitter signals and associated emission, J. Geophys. Res., 88, (A1), 295-309, 1983a.
Mielke, T. A. , C. J. Elkins, R. A. Helliwell, and U. S. Inan, Excitation of whistler mode signals via injection of polarized VLF waves with the Siple transmitter, Radio Sci., 27, (1), 31-46, 1992.