Introduction
Thunderstorm electric fields are produced by charge separation on water and ice particles in the updrafts in an active storm. The resulting charge structure is position- and time-dependent as updrafts and downdrafts rearrange charges, charging processes generate further charge separation, and lightning discharges neutralize portions of the storm. Unfortunately, little is known beyond this coarse picture. Additional measurements of the electric field would therefore be very useful.
Introduction
Thunderstorm electric fields are produced by charge separation on water and ice particles in the updrafts in an active storm. The resulting charge structure is position- and time-dependent as updrafts and downdrafts rearrange charges, charging processes generate further charge separation, and lightning discharges neutralize portions of the storm. Unfortunately, little is known beyond this coarse picture. Additional measurements of the electric field would therefore be very useful. This page first describes the electrical structure of storms, one kind of interesting and yet-unmeasured electric field associated with large lightning discharges, and a technique developed at Stanford to measure these fields.
Thunderstorm electrical structure
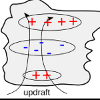
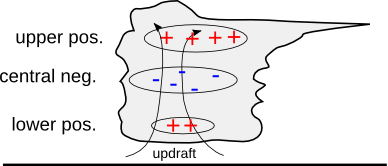
Typically, these processes result in a charge structure like that shown in Figure 1: a large region of positive charge above a large region of negative charge, possibly accompanied by a lower region of positive charge near the base of the storm. In the air surrounding the cloud, cosmic ray ionization results in a low but significant conductivity in the air. Inside the cloud, the conductivity is much lower due to attachment of free electrons and ions to water and ice particles. Think of the thundercloud as a region of insulator containing electric charges but embedded in a region of relatively good conductor. Charges will flow in the air surrounding the cloud to neutralize the cloud electric field, as there are no electric fields in a conductor. The screening charges that result shield surrounding air from the thunderstorm electric field.
These electric fields are measured by placing an electric field probe in the storm itself. This is typically done by launching balloons into the storm with sensors on board. This process is difficult and provides very limited bandwidth information. The resulting data is useful, but is difficult to interpret as the balloon only provides measurements at a single moving point in a constantly-changing electrical environment as updrafts and lightning rearrange charge in the cloud.
Quasi-static electric fields
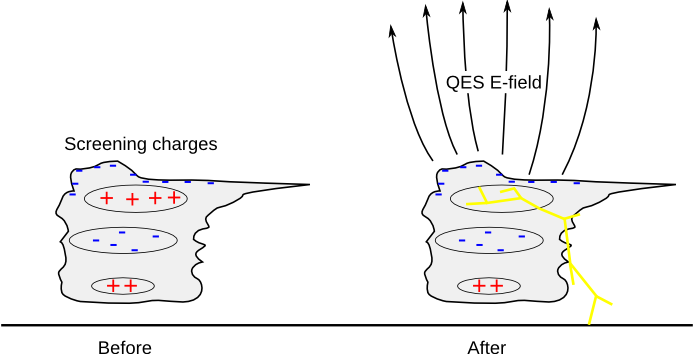
Outside the cloud, the electric fields depend strongly on the timescale of interest. Slow processes like the charging of the storm are completely shielded by the conductive atmosphere. The shielding process takes time, however, so sudden changes in the storm charges due to lightning will still be seen in the atmosphere. These fields can be understood by assuming the thunderstorm charges are completely shielded by screening charges. Any sudden changes due to lightning are, by superposition of charges, simply due to the changes in charge density in lightning. The quasi-static electric (QES) fields that result decay away as charges rearrange in the conductive atmosphere, but this takes around 0.01 seconds to 1 second, depending on the conductivity of the surrounding air, a function of altitude. Typical electric fields as produced just after a large lightning discharge are shown in Figure 2.
The effects of such electric fields have been observed for some time now. Sprites are giant electrical discharges extending downward from the ionosphere driven by QES electric fields. Clear measurements of these electric fields would allow us to test our understanding of QES field development and decay, would allow us to determine the behavior of large lightning discharges, and would shed new light on the behavior of upper atmospheric discharges like sprites.
Electric field remote sensing
The VLF group at Stanford is developing a novel optical remote sensing technique to measure these QES electric fields above and around thunderclouds. Optical remote sensing provides several advantages over balloon-launched electric field meters. First, remote sensing can be done at a distance from the storm and does not require awkward balloon launches near the most intense weather. Second, the region where the field is being measured can be moved simply by aiming the detector; multiple detectors can monitor multiple regions of interest simultaneously to make a high frame-rate movie of field development. Third, the time resolution of the optics can be higher than the time resolution of the electric field meters. Unfortunately, optical remote sensing requires a clear line of sight from a known source to the detector, which requires a relatively isolated storm and limits the geometry where good measurement is possible. In spite of these difficulties, successful measurement would proved to be extremely useful.
The Kerr effect
The remote sensing technique we are developing is based on the Kerr effect. The Kerr effect is an electric field-induced change in the relative index of refraction of different polarizations of light (birefringence). The Kerr effect is often used in “Kerr cells,” which use an electric field to modulate a beam of light via the Kerr effect in nitrobenzene. In the air surrounding a thunderstorm, the Kerr effect will understandably be quite small, so the challenge is to measure a small change in the polarization state of a known source of light.
The source of light must be extremely stable and of known polarization state. The clear blue sky turns out to be almost perfect for this measurement as it is naturally linearly polarized due to the physics of Rayleigh scattering (the same physics responsible for the blue color). The degree of linear polarization of blue light from the sky is highest at directions 90 degrees from the sun and can be higher than 90% depending on the atmospheric conditions. The Kerr effect on such a source of linear polarization is shown schematically in Figure 3. The net result is the appearance of elliptical polarization that indicates the presence of an electric field. Measurement of this elliptical polarization then can be used to determine the magnitude of the electric field.

At Stanford
More information can be found in Carlson and Inan (2008). The project to build this instrument and carry out this measurement is funded by the Defense Advanced Research Projects Agency (DARPA) under the Nimbus program.
Acknowledgement
This material is based upon work supported by the National Science Foundation under Grant No. ATM-0836326.
Any opinions, findings, and conclusions or recommendations expressed in this material are those of the author(s) and do not necessarily reflect the views of the National Science Foundation.