Overview of the Project
The satellite TARANIS (Tool for the Analysis of RAdiation from LightNIng and Sprites) is a project by the French space agency Centre National d’Études Spatiales (CNÉS) to study a number of lightning related phenomena, including:
Overview of the Project
The satellite TARANIS (Tool for the Analysis of RAdiation from LightNIng and Sprites) is a project by the French space agency Centre National d’Études Spatiales (CNÉS) to study a number of lightning related phenomena, including:
- Transient Luminous Events (TLEs),
- Terrestrial Gamma Ray Flashes (TGFs), and
- Runaway electrons accelerated upwards from the atmosphere.
The Stanford Very Low Frequency (VLF) Group is working with CNÉS and the Laboratorie de Physique et Chimie de l’Environment et de l’Espace (LPC2E) to build a Field Programmable Gate Array (FPGA) to automatically detect the occurence of a special kind of electromagnetic wave known as 0+ whistlers. The information provided by the 0+ whistler detector will allow for the unambiguous association of lightning with TLEs and TGFs, which in turn will offer a better understanding of the physical mechanisms behind them. Furthermore, variation in TLEs and TGFs is most likely driven by variations in the parent lightning strike that also generates a 0+ whistler.
Description of 0+ Whistlers
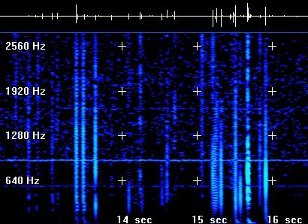
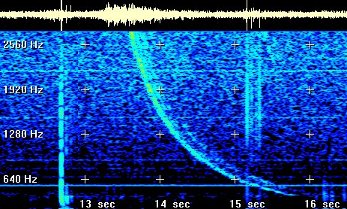
Whistlers are electromagnetic waves in the Very Low Frequency (VLF) spectrum produced by lighting that travel along the Earth’s magnetic field lines. When lightning strikes, it generates a short duration, broadband electromagnetic impulse. Most of the energy will travel along what’s known as the Earth-Ionosphere waveguide as a radio atmospheric (often sferic for short), but some of the energy escapes this waveguide and propagates into the magnetosphere along the Earth’s magnetic field lines. See Figures 1 and 2 for example spectrograms showing sferics and whistlers, respectively.
 |
 |
|
| Figure 1: Spectrogram of Sferics. Source: http://www.spaceweather.com/glossary/inspire.html. |
Figure 2: Spectrogram of a Whistler. Source: http://www.spaceweather.com/glossary/inspire.html. |
As a whistler propagates, it undergoes dispersion, which results in a distinctive spectrogram with higher frequencies arriving first and lower frequencies arriving later, as shown in Figure 2 above. In fact, whistlers got their name for the whistling sound they create when converted directly to audio. The 0+ refers to where along its propagation path the whistler wave is. See Figure 3 for a diagram of how whistlers propagate in Earth’s magnetosphere. In the diagram, a lightning strike in the Northern Hemisphere creates a whistler that propagates along Earth’s magnetic field to the Southern Hemisphere and then returns back to the Northern Hemisphere after reaching the ionosphere.
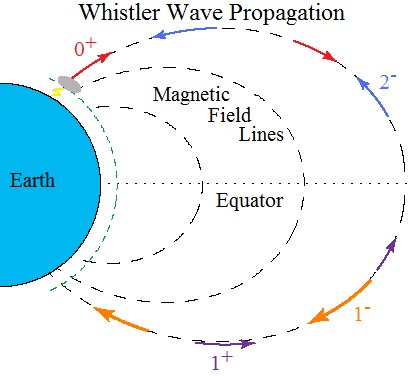 |
| Figure 3: Whistler Wave Propagation. |
Detection Algorithm
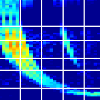
The algorithm which the Stanford VLF group has developed to detect whistler waves looks for the distinctive spectrogram pattern of Figure 2. In particular, an example 0+ whistler from TARANIS’s predecesor satellite, DEMETER, is shown in Figure 4. Note that a 0+ whistler has only experienced enough dispersion to last a total of about 0.2 seconds.
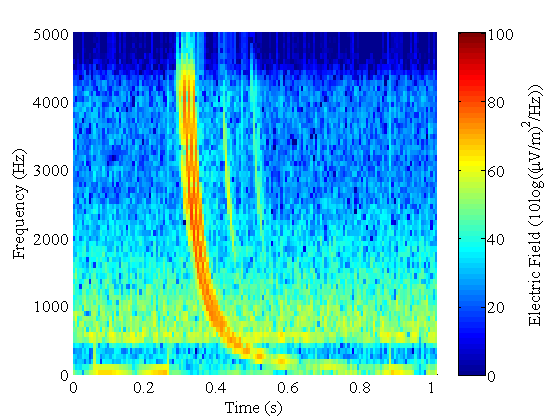 |
| Figure 4: Example 0+ Whistler. |
The algorithm starts by creating spectrograms of the data. After subtracting out the noise from each spectrogram, the spectrograms are binned in an as yet to be determined manner. See Figure 5 for a possible binning configuration. The spectrogram shown is zoomed in from Figure 4 above, and the white bars show where the spectrogram will be binned.
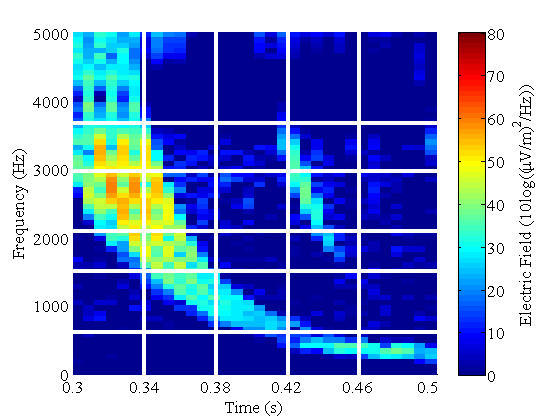 |
| Figure 5: 0+ Whistler after Spectrogram Binning. |
The average value in each bin is then computed, which is shown in Figure 6 below. The resulting matrix is then multiplied term by term by an also as yet to be determined scoring matrix that picks out the 0+ whistler shape, and then each value is summed to get a single number. If the sum is greater than a certain threshold, the spectrogram is assumed to be a 0+ whistler.
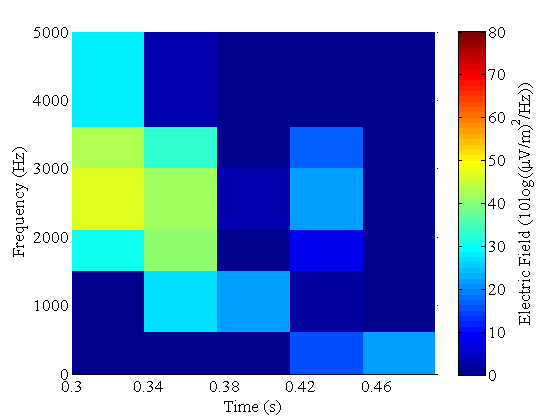 |
| Figure 6: 0+ Whistler after Spectrogram Binning. |
Useful Links
- TARANIS homepage: http://smsc.cnes.fr/TARANIS/
- Stanford VLF Group homepage: http://nova.stanford.edu/~vlf/
- DEMETER homepage: http://smsc.cnes.fr/DEMETER/
- Wikipedia page on whistlers: http://en.wikipedia.org/wiki/Whistler_%28radio%29
Acknowledgments
This work is supported in part by the U. S. Department of Defense through a National Defense Science and Engineering Graduate Fellowship awarded to Andrew Compston.
Bibliography
Budden, K. G. (1961), Radio Waves in the Ionosphere, Cambridge Univ. Press, Cambridge, England.
Helliwell, R. A. (1965), Whistlers and Related Ionospheric Phenomena, Stanford Univ. Press, Stanford, Calif.
Helliwell, R. A. (1969), Low-frequency waves in the magnetosphere, Rev. Geophys., 71(1, 2), 281-303.
Melrose, D. B. (1987), Frequecy Splitting in Stria Bursts: Possible Roles of Low-Frequency Waves, Solar Physics, 87, 359-371.
Okada, T. and A. Iwai (1988), Natural VLF Radio Waves, John Wiley & Sons, Inc., New York.
Uman, M. A. (1963), Lightning, McGraw-Hill, San Francisco.